
Regional Demographics
Like many regions, including nearby Pittsburgh, the Weirton-Steubenville metropolitan area has experienced a decline in overall population over the decade.
According to the US Census Bureau’s annual population estimates, the tri-county population dropped from 124,454 in 2016 to 119,271 in 2016. The tables below show counts for Brooke (WV), Hancock (WV) and Jefferson (OH) counties, and each of the region’s cities and towns.
Steubenville, Ohio, had the smallest loss in population during this time period, with only a 3.1% drop. In West Virginia, the college town of Bethany lost the least amount of residents, resulting in just a 3.3% decline.
On the loss side, Beech Bottom topped the West Virginia list, losing 6.1% of its 2010 population of 523. Irondale, Ohio, lost the most residents in the region, a 7.2% drop from its 2010 total of just 387. But these basic population headcounts don’t’ tell the whole story.
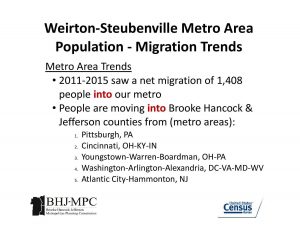
Our region, like others with older residents, continues to experience more deaths than births. But embedded within population trends is a second story – migration. And between 2011-2015, more people moved into our region than moved out.
In fact, the Weirton-Steubenville area had a net in-migration of 1,408 people, who moved into the area from Pittsburgh, Cincinnati, Youngstown, OH, and Washington, D.C.
This bit of information tells us some good news – that as unemployment has dropped and new companies have come in, people are choosing to live in the Weirton-Steubenville area, ensuring that we have a vibrant community life and active workforce.
| COUNTIES | 2010 | 2016 | # CHANGE | % CHANGE |
| Brooke Co, WV | 24,069 | 22,977 | -1,092 | -4.5 |
| Hancock Co, WV | 30,676 | 29,590 | -1,086 | -3.5 |
| Jefferson Co, OH | 69,709 | 66,704 | -3,005 | -4.3 |
| CENTRAL CITIES | 2010 | 2016 | # CHANGE | % CHANGE |
| Steubenville, OH | 18,659 | 18,072 | -587 | -3.1 |
| Weirton, WV | 19,746 | 18,989 | -757 | -3.8 |
| BROOKE CO, WV | 2010 | 2016 | # CHANGE | % CHANGE |
| Beech Bottom | 523 | 491 | -32 | -6.1 |
| Bethany | 1,036 | 1,002 | -34 | -3.3 |
| Follansbee | 2,986 | 2,838 | -148 | -5.0 |
| Wellsburg | 2,805 | 2,657 | -148 | -5.3 |
| Windsor Heights | 423 | 394 | -29 | -6.9 |
| HANCOCK CO, WV | 2010 | 2016 | # CHANGE | % CHANGE |
| Chester | 2,585 | 2,474 | -111 | -4.3 |
| New Cumberland | 1,103 | 1,051 | -52 | -4.7 |
| JEFFERSON CO, OH | 2010 | 2016 | # CHANGE | % CHANGE |
| Adena | 759 | 725 | -34 | -4.5 |
| Amsterdam | 511 | 483 | -28 | -5.5 |
| Bergholz | 664 | 632 | -32 | 4.8 |
| Bloomingdale | 202 | 196 | -6 | -3.0 |
| Dillonvale | 665 | 64 | -31 | -4.7 |
| Empire | 299 | 277 | -22 | -7.4 |
| Irondale | 387 | 359 | -28 | -7.2 |
| Mingo Junction | 3,454 | 3,302 | -152 | -4.4 |
| Mount Pleasant | 478 | 451 | -27 | -5.6 |
| New Alexandria | 272 | 263 | -9 | -3.3 |
| Rayland | 417 | 396 | -21 | -5.0 |
| Richmond | 481 | 455 | -26 | -5.4 |
| Smithfield | 869 | 830 | -39 | -4.5 |
| Stratton | 294 | 274 | -20 | -6.8 |
| Tiltonsville | 1,372 | 1,312 | -60 | -4.4 |
| Toronto | 5,091 | 4,851 | -240 | -4.7 |
| Wintersville | 3,924 | 3,774 | -150 | -3.8 |
| Yorkville | 1,079 | 1,038 | -41 | -3.8 |
Source: U.S. Census Bureau