
Employment Trends
Civilian Labor Force 2008 – August 2017 – A rollercoaster of a decade
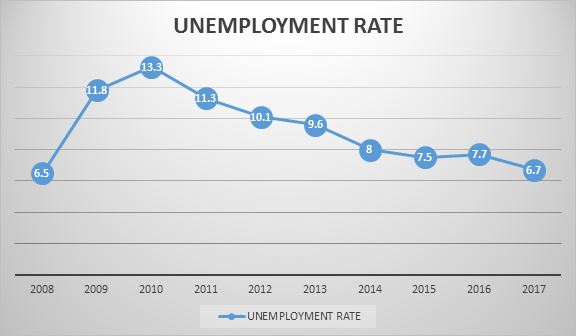
Over the last 10 years, the regional story of unemployment looks a bit like the blueprint for a rollercoaster.
The ride begins in Spring 2008, when the unemployment rate was at a ten-year low of 5.9%, with 54,000 people employed in the Weirton-Steubenville area.
The track grew steep in the summer of 2009 when employment had more than doubled to 11.9%, with just over 51,500 out of the 58,500-member workforce still in their jobs. And the climb wasn’t over.
In February 2010, the rollercoaster peaked at 13.8% unemployment, with 8,180 people out of work. The massive job losses evidenced the region’s struggle to sustain its steel-heavy manufacturing base. Issues at both National (Weirton) Steel in Weirton and Wheeling-Pittsburgh Steel (Benwood and Beech Bottom, WV, and Steubenville, OH) started in the mid-1980s, ending in bankruptcies for each facility in 2004 and 2012, respectively.
As steel jobs disappeared, residents of the Weirton-Steubenville area found themselves strapped in for a long climb, with unemployment rates above 13% for all of 2010. Finally, in January 2012, the ride started downhill. By December 2012, unemployment had fallen to 9.9% with 5,580 people still looking for work.
With the stabilization of remaining industrial companies and growth in other sectors including energy/shale, value-added metals, and healthcare, unemployment continued to ride a downward track, falling to 8% by December 2014 to 7.7% in December 2016.
As of August 2017, unemployment stands at 6.7%, with just 3,416 members of the 52,000 civilian labor force unemployed. With continued gains in metals manufacturing, natural gas drilling, and healthcare, the businesses and residents of Brooke Hancock and Jefferson counties are confident that the job-loss thrill ride is behind them!
| YEAR | PERIOD | LABOR FORCE | EMPLOYMENT | UNEMPLOYMENT | UNEMPLOYMENT RATE |
| 2017 | Annual | 50,674 | 47,258 | 3,416 | 6.7 |
| 2016 | Annual | 51,649 | 47,682 | 3,967 | 7.7 |
| 2015 | Annual | 52,456 | 48,521 | 3,934 | 7.5 |
| 2014 | Annual | 53,039 | 48,825 | 4,214 | 8.0 |
| 2013 | Annual | 54,402 | 49,178 | 5,224 | 9.6 |
| 2012 | Annual | 55,671 | 50,063 | 5,608 | 10.1 |
| 2011 | Annual | 56,611 | 50,246 | 6,365 | 11.3 |
| 2010 | Annual | 58,386 | 50,617 | 7,769 | 13.3 |
| 2009 | Annual | 58,561 | 51,658 | 6,904 | 11.8 |
| 2008 | Annual | 58,723 | 54,898 | 3,825 | 6.5 |
Source: U.S. Bureau of Labor Statistics